
Part of the Flood Intel Platform
The technology behind smarter flood management
A bespoke hydrodynamic modelling suite that re-runs every hour, all year round, forecasting flooding at property level up to 48 hours ahead and verified on the ground by our managed ground-truth sensors, grounded in two decades of Loughborough research and peer review.
See the model run on your own sites. No obligation.

The difference
What is hydrodynamic flood modelling?
Hydrodynamic flood modelling simulates how water actually moves and accumulates during a storm, accounting for local terrain, drainage capacity and how wet the ground already is. Many surface-water tools instead combine rainfall with static flood maps or simplified models, which give a rough indication but often miss real behaviour on the ground.
Without it: alerts you can't fully trust.
Static maps and simplified models can flag areas that don't flood and miss areas that do.
With Previsico: alerts that reflect what will actually happen.
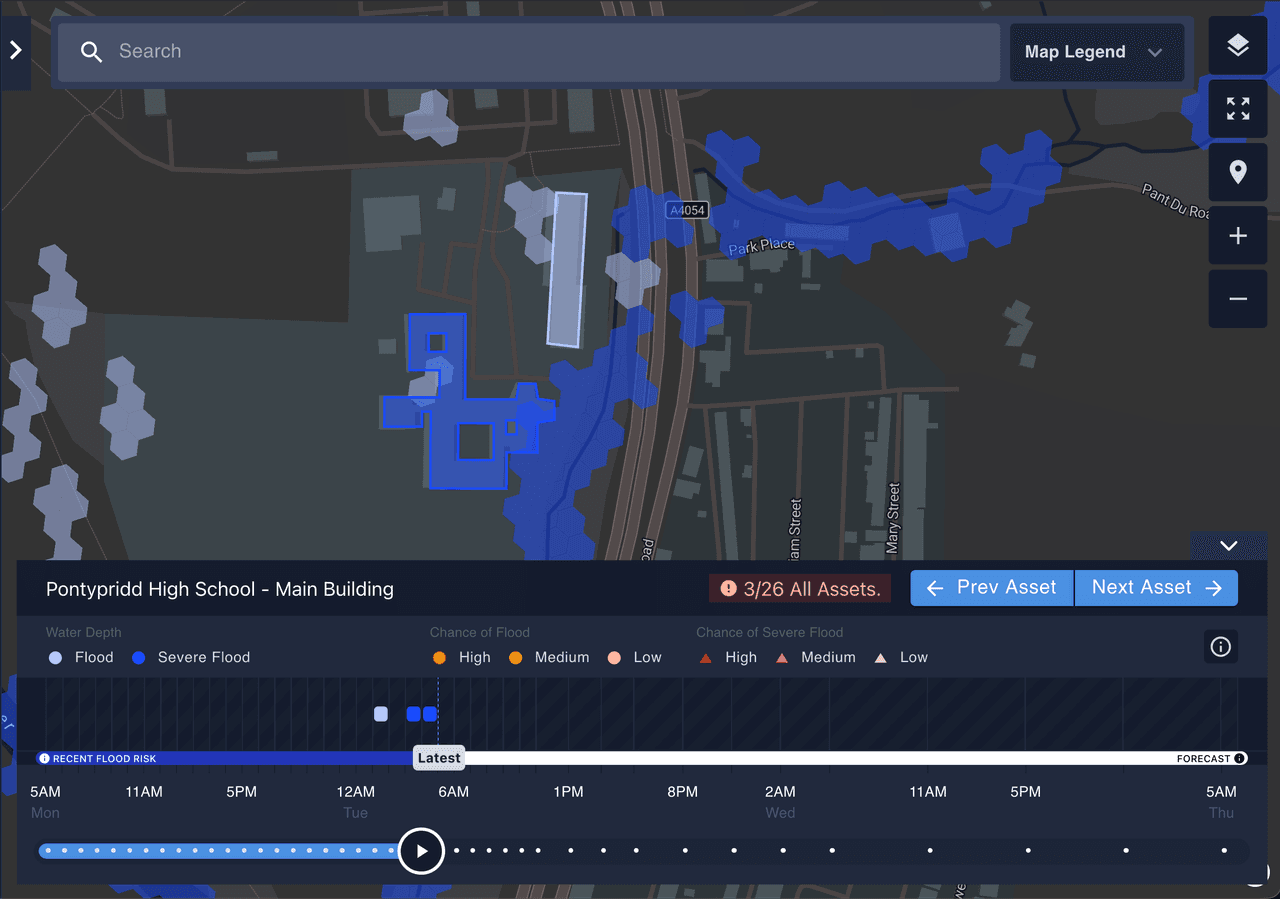
The model factors in drainage, terrain and antecedent conditions to simulate where water will pool and how deep, at each asset.
Probabilistic, not a single answer.
It shows likelihood and severity per location, not one worst-case line, so you can prioritise response where it's most likely to matter.
Under the hood
What data goes into a Previsico flood forecast?
Previsico parameterises its FloodMap suite with global, regional and local data, then combines rainfall ensembles with a range of drainage and ground conditions to generate a multi-scenario flood library.
The best-available elevation data, typically LiDAR in Europe and the US, processed with a proprietary approach for hydrological connectivity and local features.
Selected by best local performance, with current providers including the Met Office and IBM's Weather Company.
Drainage maps and sensor data, updated ahead of each run; clients can share local knowledge so adjustments are made where networks don't perform as expected.
A combination of global and national land-use, soil and geology maps plus satellite imagery, used to parameterise the model.
The model simulates preceding rainfall and ground wetness, adjusting the parameters affected by wetness, including drainage capacity and hydraulic conductivity.
An easy-fit, radar-based depth sensor with continuous monitoring and full diagnostics, so readings feed straight into the live model.
Probabilistic forecasting
Why probabilistic, not worst-case?
Instead of a single yes/no line, Previsico shows the likelihood and severity of flooding at each location, low, medium or high chance, with median depth, calculated from the share of 200+ modelled scenarios that exceed flood and severe-flood thresholds.
A view of uncertainty.
Likelihood, severity and median depth per asset, 48 hours ahead, refreshed hourly, so you can focus effort where it's most needed.
What is probabilistic flood forecasting?Modelling that learns over time.
Forecasts are continually calibrated against sensor data, customer feedback and flood-event reports, so accuracy improves, especially in complex urban areas.
A 24-hour lookback, Instacast.
A deterministic map from observed radar rainfall shows where flooding has likely already formed, at the same property-level detail, bridging what has happened and what may happen next.
What is Instacast?Live monitoring
How do the sensors verify a forecast?
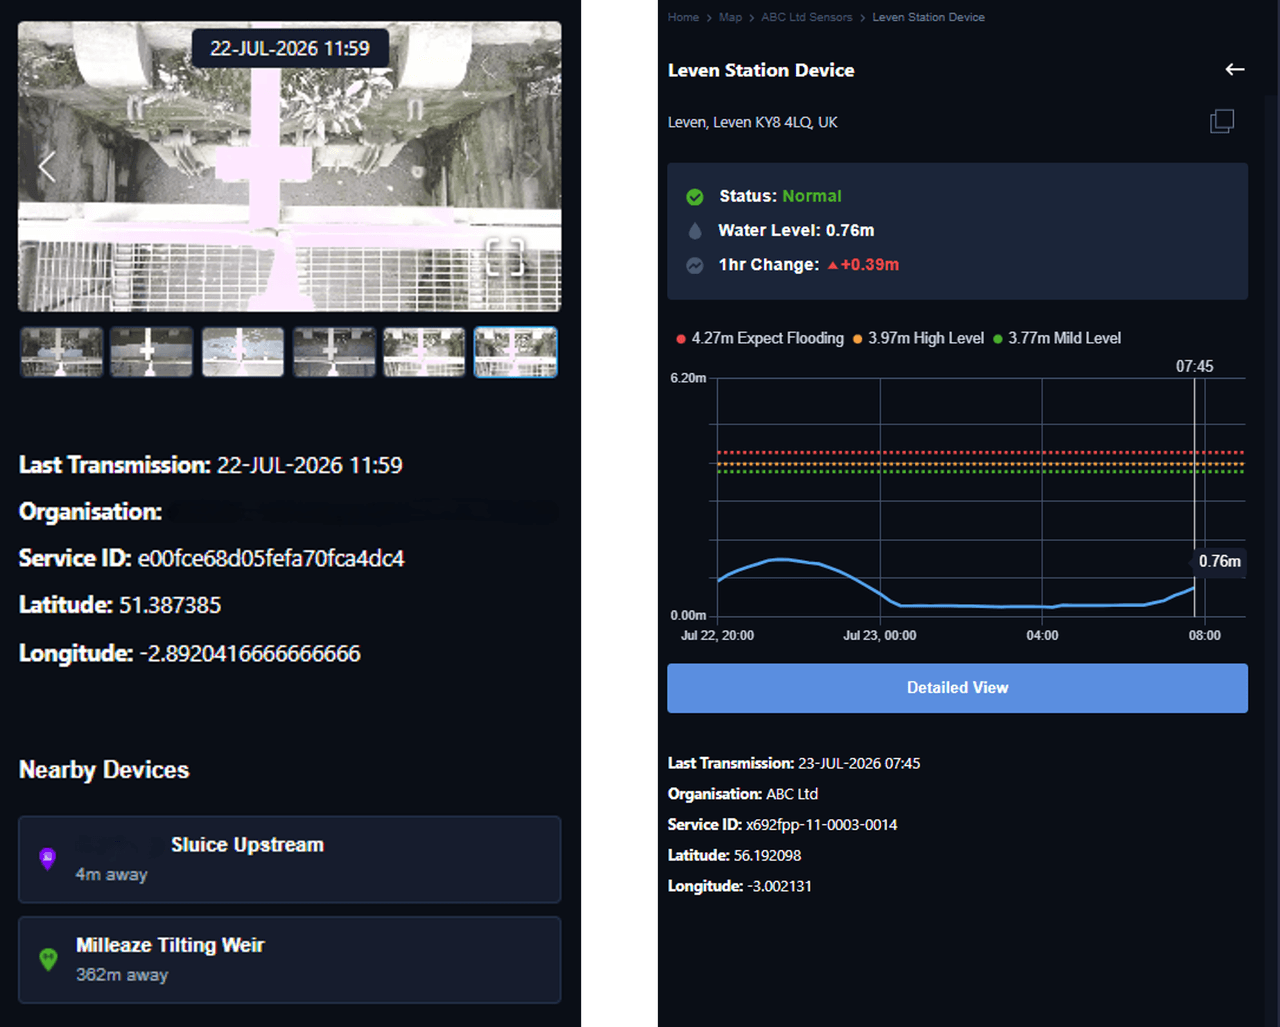
Previsico manages the ground-truth radar flood sensors and cameras, integrated into the platform, giving millimetre-accurate, near-real-time water levels at the sites that matter most to your risk profile.
Non-contact radar depth measurement, sited around your risk.
No submerged parts, so it keeps working in high-flow or debris-laden conditions, with full signal diagnostics on every reading.
- Risk-profile-led site selection, with landowner consent and installation managed by Previsico
- 4G connectivity with 3G/2G fallback keeps data flowing in areas of limited coverage
- Monitoring flags site issues that raise flood risk between visits, such as vegetation build-up around drainage, so preventative maintenance happens before it becomes an alert
Integrated into your dashboard, monitored.
Sensor readings feed directly into the platform alongside forecast data, for one operational view of water levels and alert thresholds.
- 5+ years battery life; no mains power required
- Previsico's technical team monitors for anomalies and data-quality issues
- Near-real-time alerts so response teams are notified at the right moment
Grounded in evidence, not guesswork.
FloodMap+, the engine behind every Previsico forecast, is peer-reviewed and published in leading journals including Nature, Nature Water and Hydrological Processes, and has been used in research globally.
It is built on two decades of Loughborough University research, Previsico is a Loughborough spin-out and a Lloyd's Lab alumnus.
The evidence holds up operationally, not just in the lab: National Grid has seen repeated multi-site loss avoidance, and a major UK construction joint venture avoided a seven-figure loss at a single site.
Institutional credibility
A Loughborough University spin-out and Lloyd's Lab alumnus.


See the science on your own sites.
Talk to our team or explore how Previsico works for your sector.