How Storm Chandra exposed the growing reality of flood risk across the UK
- Written by
 Lauren Legate
From 26 to 27 January 2026, Storm Chandra swept across the UK, bringing a period of severe weather marked by strong winds and prolonged heavy rainfall over already saturated ground.
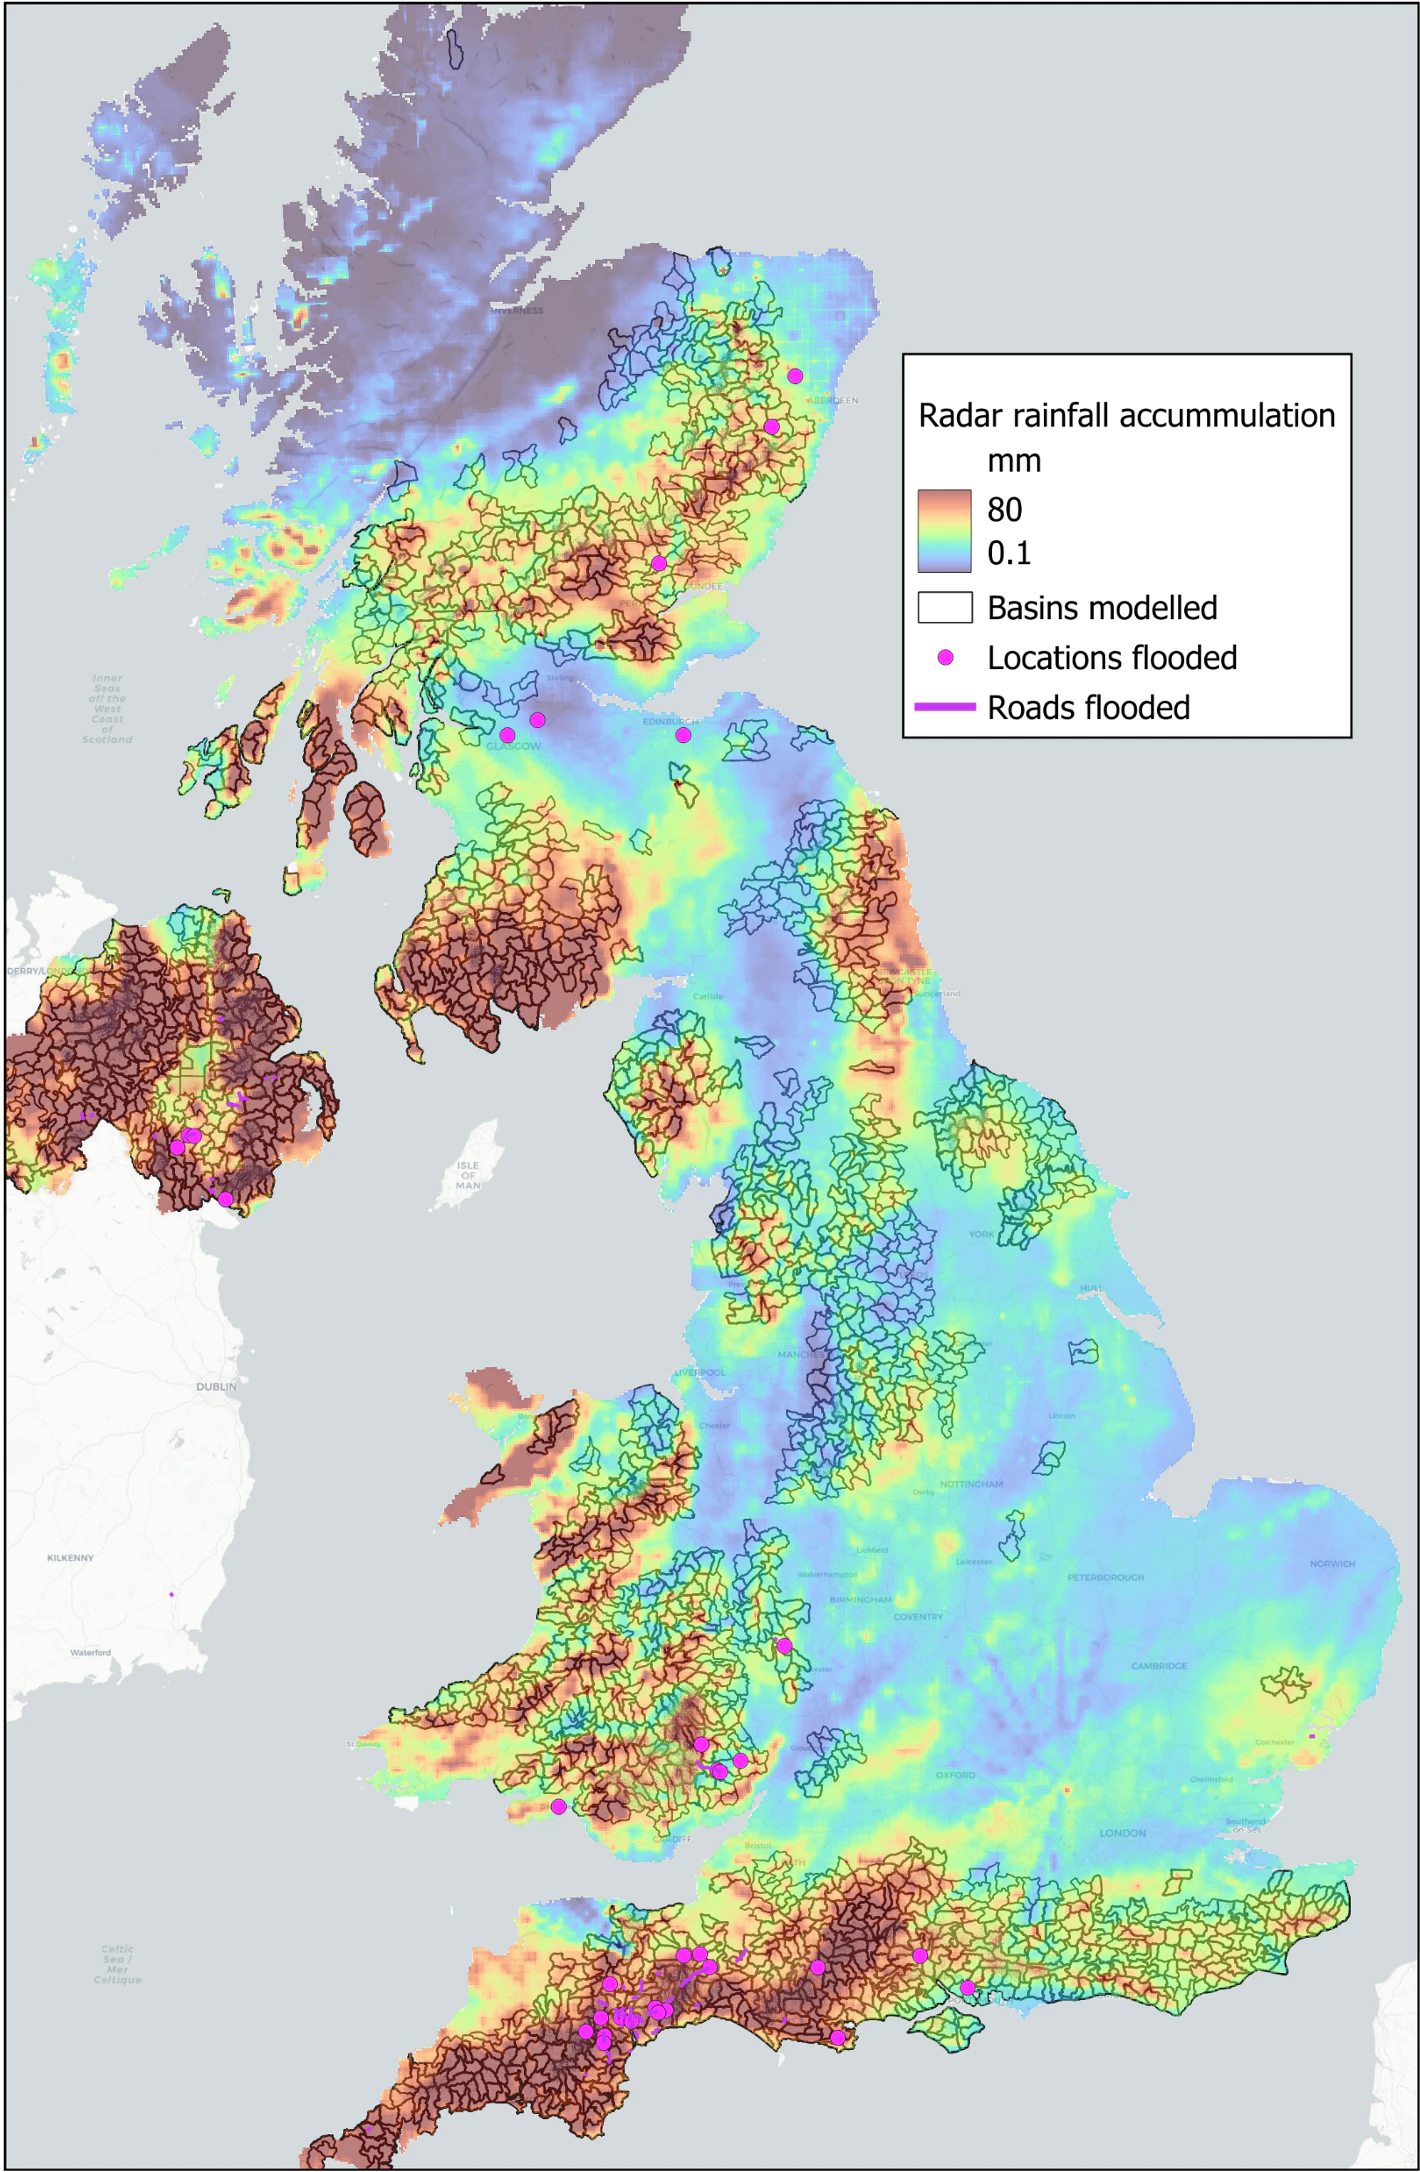
The most significant impacts from Storm Chandra in the UK were concentrated across southwest England, particularly in Devon, Cornwall, and Somerset, as well as parts of Dorset, Hampshire, Northern Ireland, and southern Scotland.
In Northern Ireland, counties including Derry, Down, and Antrim were placed under amber warnings for heavy rainfall and damaging winds, with gusts reaching around 70–75 mph in exposed coastal areas.
Storm Chandra followed weeks of unsettled weather that left the ground and drainage systems unable to absorb further rain. This combination, persistent rainfall, saturated ground, and rapid runoff, is increasingly characteristic of flood events across the UK. (1)
Highest UK rainfall totals from Storm Chandra
A number of sites exceeded 80 mm, with the wettest locations seeing over 110 mm of rain (1):
White Barrow, Devon – 115.1 mm
The highest rainfall total occurred during Storm Chandra, when persistent heavy rain continued through the morning of 27 January.
Katesbridge, County Down – 114.8 mm
Katesbridge also featured prominently in the hourly rainfall records, indicating repeated episodes of intense precipitation
Banagher, Caugh Hill, Londonderry – 83.2 mm
Another notably high total was recorded in Northern Ireland, illustrating the northward pivot of Chandra’s main rainfall band.
The flood impact
At Previsico, our flood forecasting model sent out alerts to customers across the UK to warn them of impending flooding. On our dashboard, we showed depths reaching 3m in some small waterways.
Our water-level sensors also sent out alerts across England and Wales, providing customers with real-time data of their sites' exposure to rising water levels.
Validation of Previsico’s data
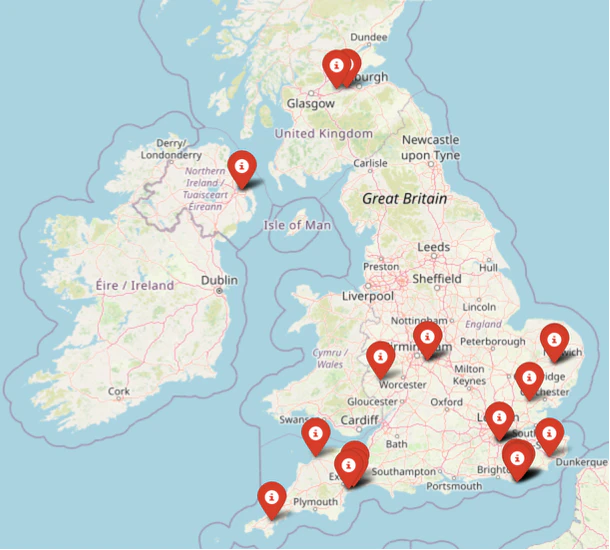
The performance of Previsico’s flood forecasting models during Storm Chandra was validated through multiple independent real-world data sources, including ground-level impact reports, road closure information, satellite imagery, and on-the-ground observations from affected communities.
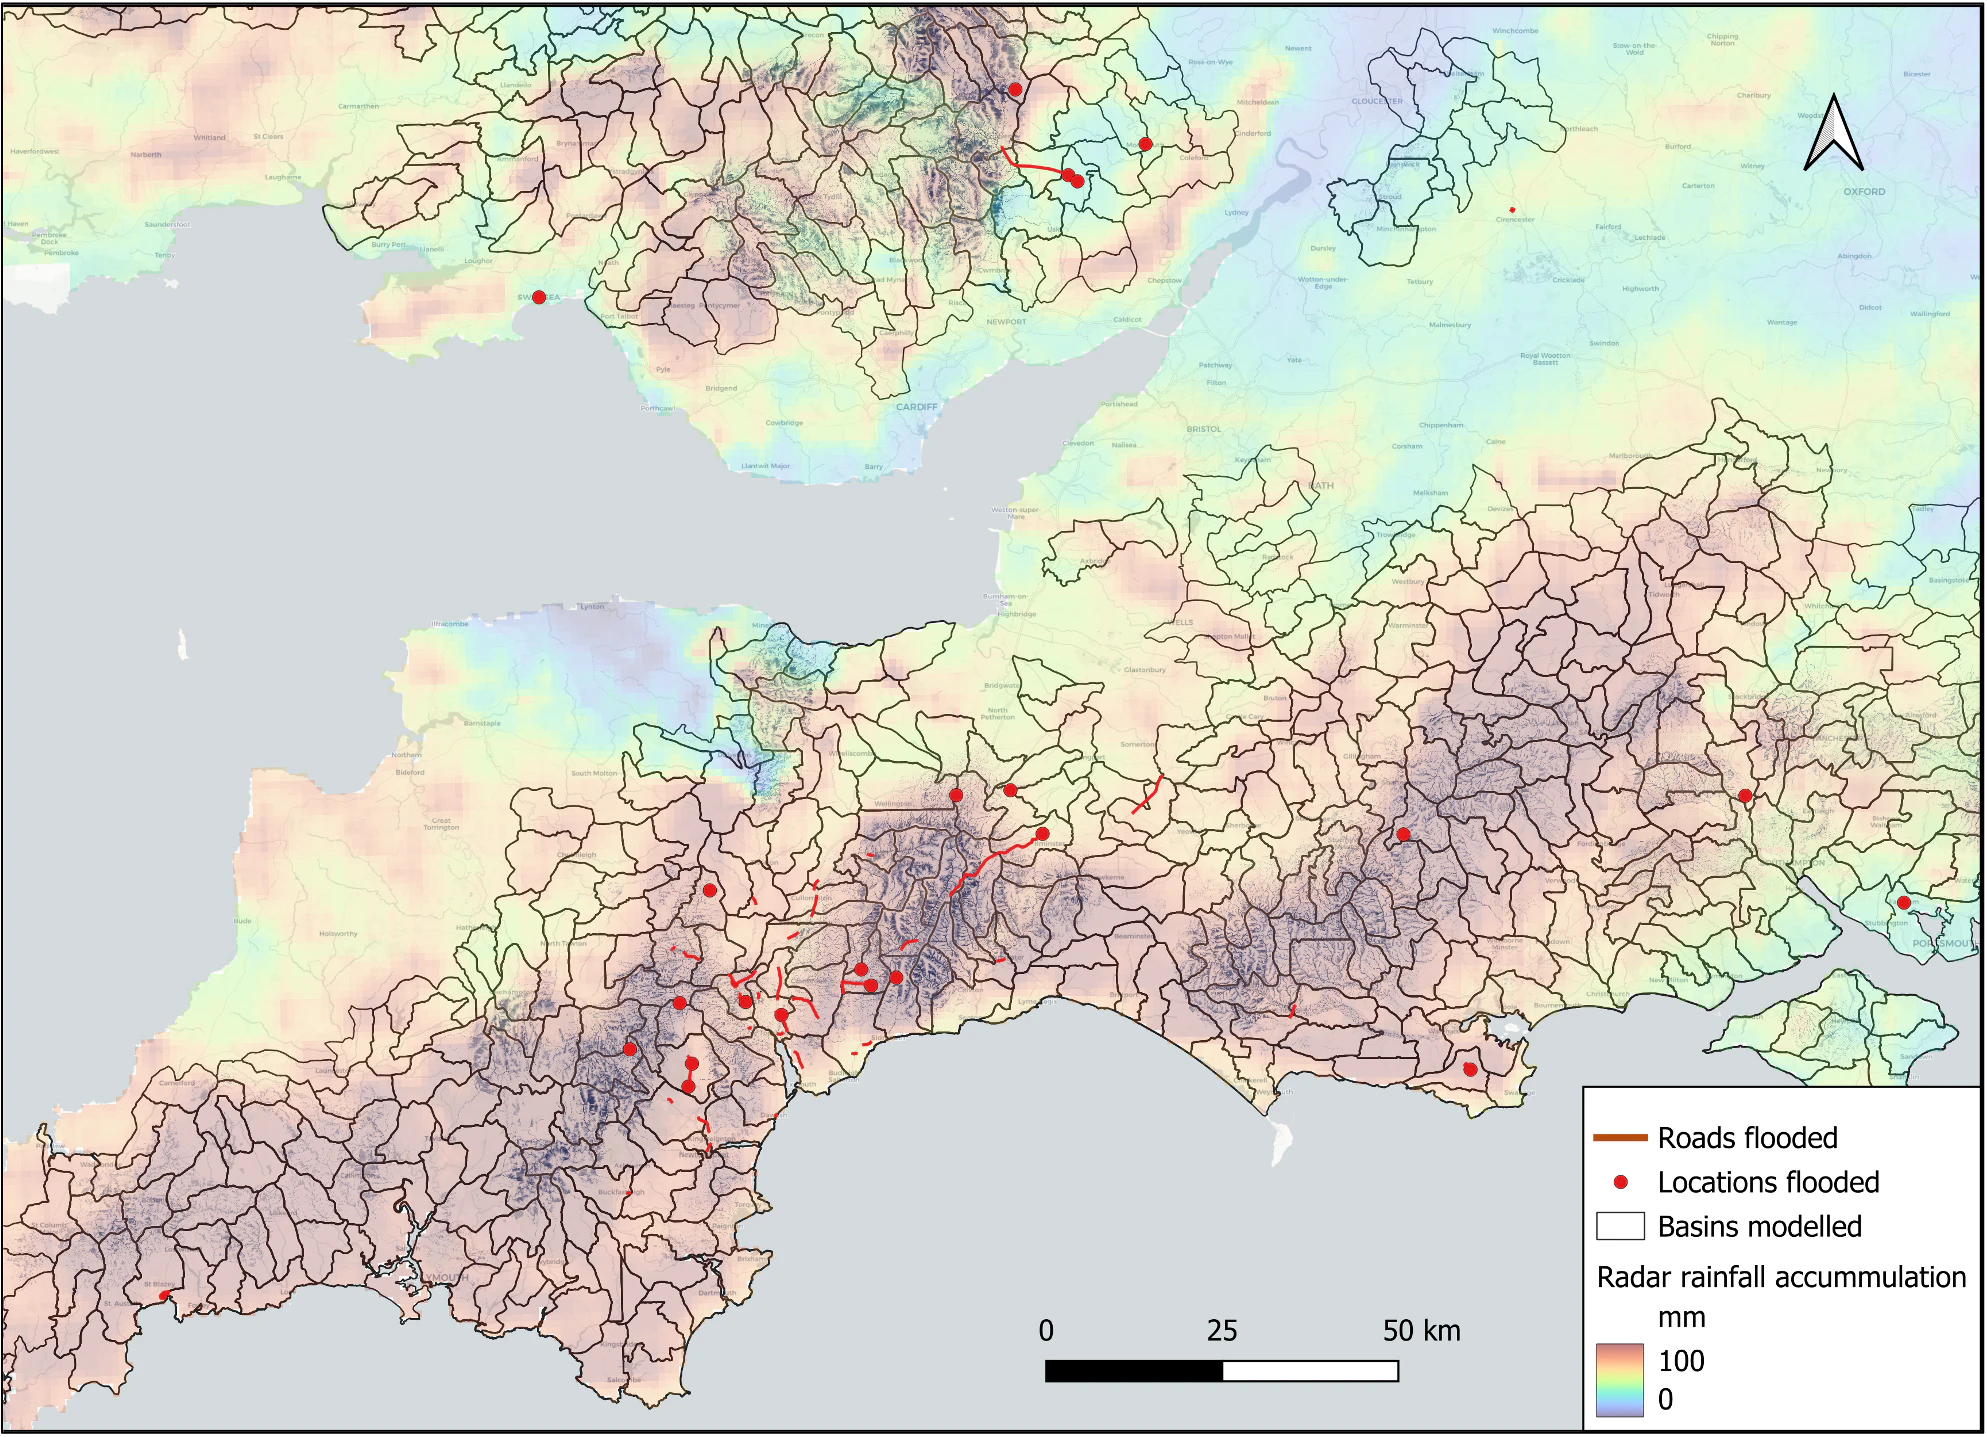
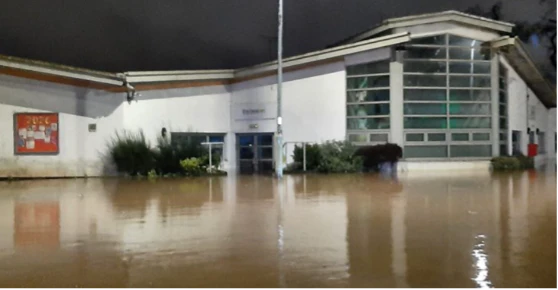
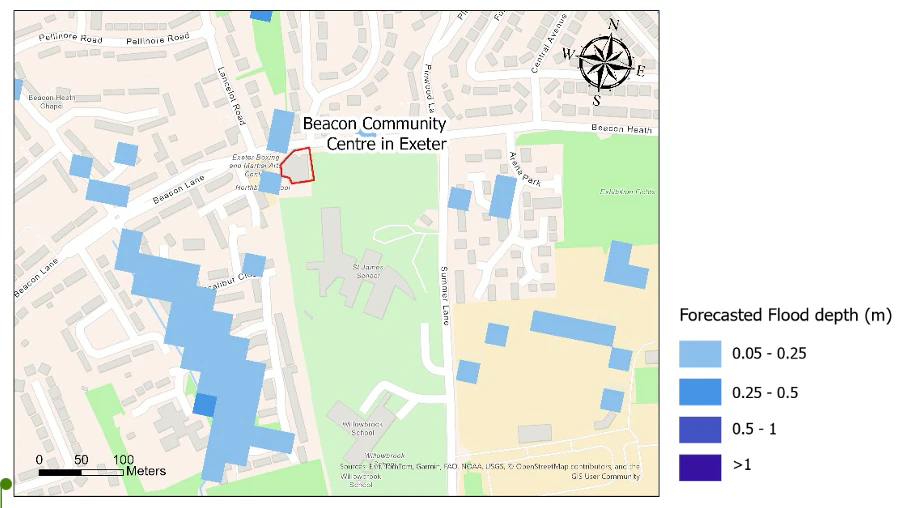
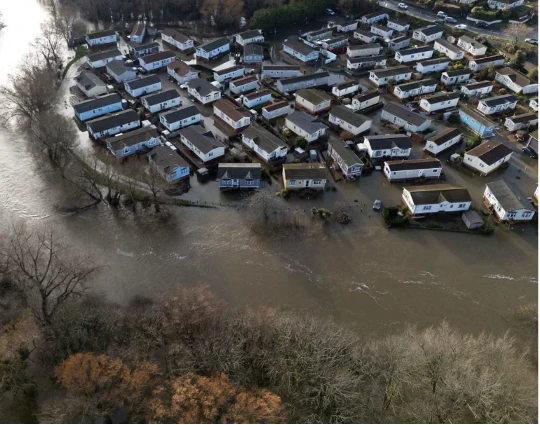
In Exeter, flooding at the Beacon Community Centre provided a clear case study for model validation. Local reports and appeals for volunteers confirmed surface water flooding at the site, which directly aligned with Previsico’s forecast outputs showing high flood depths and surface water accumulation in the surrounding area.
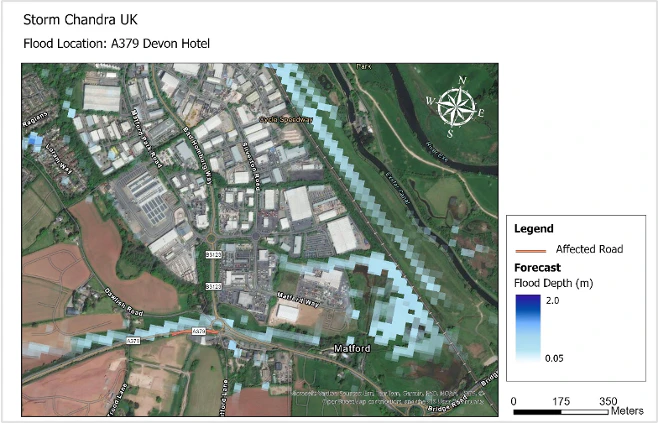
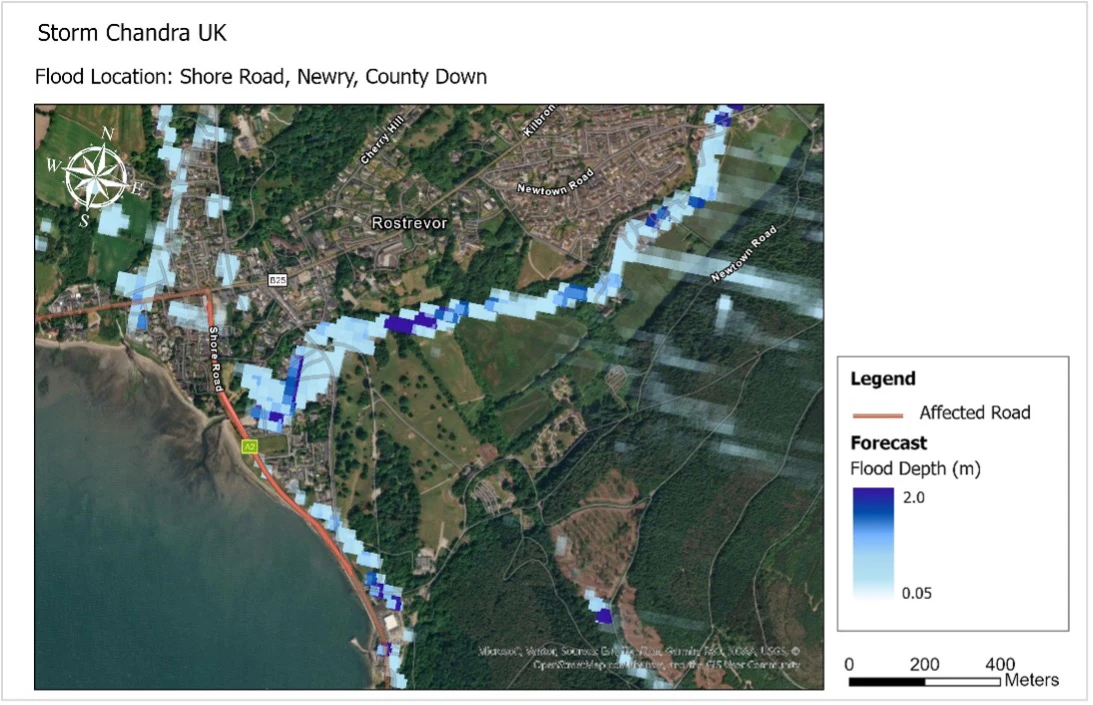
This alignment was replicated across multiple locations in southern England and Northern Ireland. Forecast outputs in Matford and Newry consistently corresponded with reported flooding incidents and road closures shared via social media, local news, and transport updates. In each case, Previsico’s model identified high-risk zones and flood pathways that matched observed impacts on transport infrastructure and urban areas.
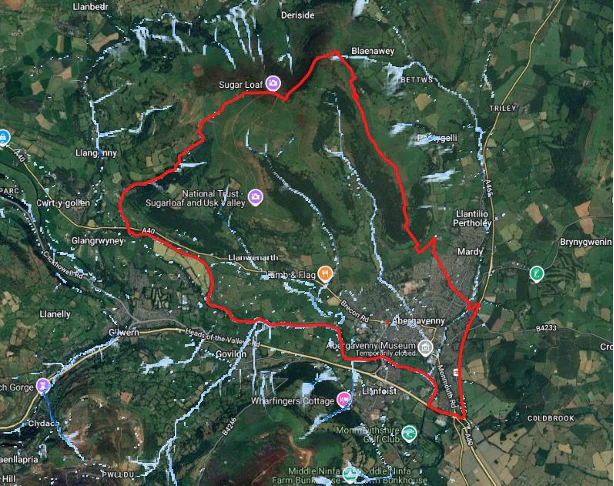
Further validation was observed in Abergavenny, where Previsico’s flood model forecasted flooding along key transport routes. This was subsequently confirmed by real-world reports of flooding on the A40, a location with a known history of repeat flood events.

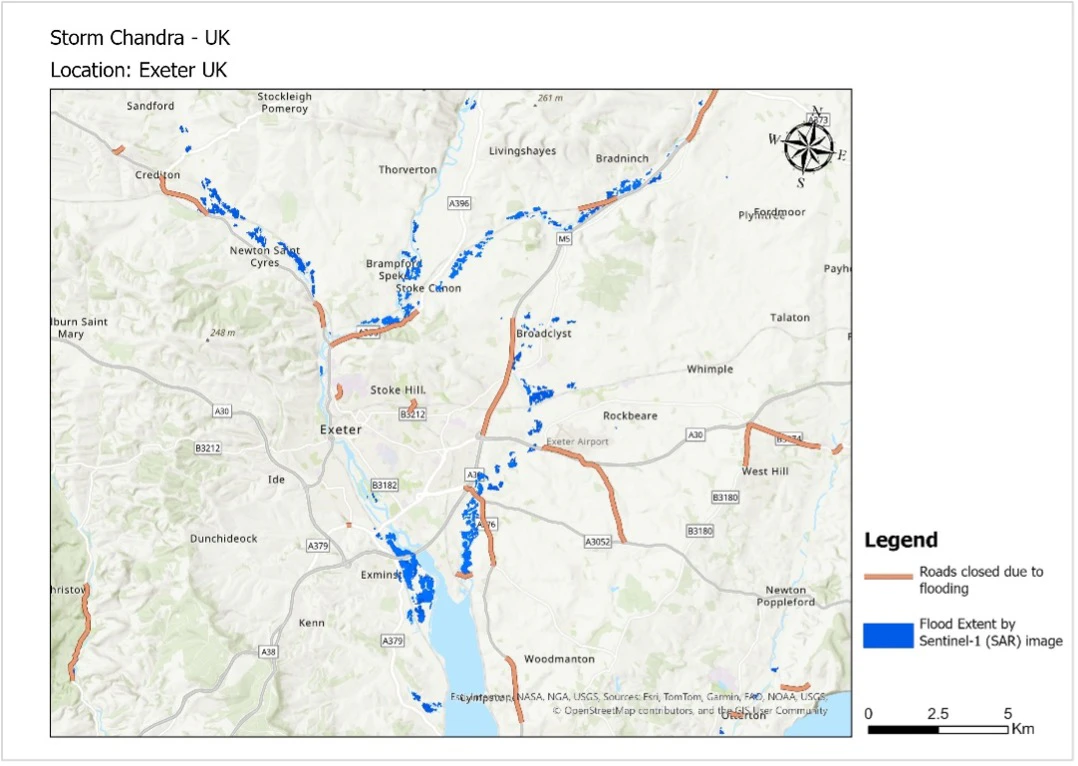
Flooding visible in satellite imagery
Satellite data provided additional independent verification. Flood extents associated with Storm Chandra was clearly visible in Sentinel-1 SAR imagery captured between 26–28 January 2026. This satellite observation aligned with Previsico’s forecasted flood extents, particularly in areas such as Exeter where surface water and river flooding were clearly identifiable. (5)
Aftermath of Storm Chandra
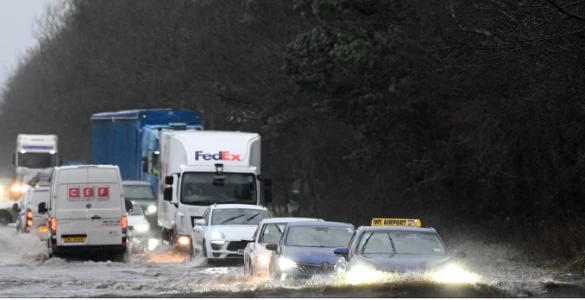
In the aftermath of Storm Chandra, the scale of disruption across the country was stark. Nearly 150 Environment Agency flood alerts were in force across England, highlighting the widespread pressure on river catchments and drainage systems. As communities were still dealing with the initial impacts, a yellow Met Office rain warning was issued for large parts of southwest England from noon until midnight on Thursday, raising concerns of further rainfall compounding already saturated ground conditions.
Authorities warned that continued heavy rain could trigger additional surface water and river flooding, putting roads, homes, businesses, and critical infrastructure at renewed risk. For many areas, this created a prolonged emergency response scenario, where recovery efforts were forced to run in parallel with preparations for further flooding, underlining the severe and ongoing impact of Storm Chandra on communities and services alike.
Our forecasts outputs aligned with reported flooding, which shows that the impactful flooding on roads and key transport routes was both predictable and preventable. The impacts of storm Chandra show that as storms and extreme rainfall becomes more frequent (excessive, persistent rain, falling on already wet ground) recovery windows shorten and communities are increasingly forced to respond to flooding while still under threat of the next flood event.
References:
1. https://www.metoffice.gov.uk/blog/2026/rainfall-records-for-storm-chandra
4. https://www.dailymotion.com/video/x9ylllc
5. global-flood.emergency.copernicus.eu/general-information/data-and-services/