
One platform. Every flood, before it costs you.
The Flood Intel Platform is Previsico's live flood-forecasting platform: probabilistic property-level alerts, managed ground-truth sensors and cameras, and a dashboard, email, text message and API alerts, from a single site to a global book.
See your own sites on the platform. No obligation.

The platform
Modelling and hardware, in one operational view.
The Flood Intel Platform combines two engines, a live, physics-based hydrodynamic forecast and managed ground-truth radar sensors and cameras that verify what is happening on the ground. Both reach you the same four ways: a web dashboard, email, text message, and a REST API. It scales from one building to a global portfolio, so the risk, resilience and claims teams who carry flood exposure can see it, rank it, and act on it.
Live hydrodynamic forecast
See the forecastGround-truth sensors & cameras
See the sensorsDashboard · email · text · API
See how alerts arriveOne site to a global book
See the portfolio viewWhat's inside
Five parts, one platform.
Probabilistic flood forecasts
Likelihood, severity and median depth per asset, 48 hours ahead, refreshed hourly.
Learn moreInstacast: 24-hour lookback
See where flooding has likely already formed, updated hourly from observed radar rainfall.
Learn moreManaged ground-truth sensors & cameras
Radar level sensors and cameras confirm live water levels on the sites that matter, with the network managed and guaranteed working, not just raw data.
Learn moreDashboard, email & text alerts
Triage assets by risk, map flooding at property level detail, and get alerts on a set cadence before onset.
Learn moreREST API
Pull every alert, risk timeline, map layer and sensor reading straight into your own systems.
Learn moreOne platform
Forecast, sensors and history in a single view.
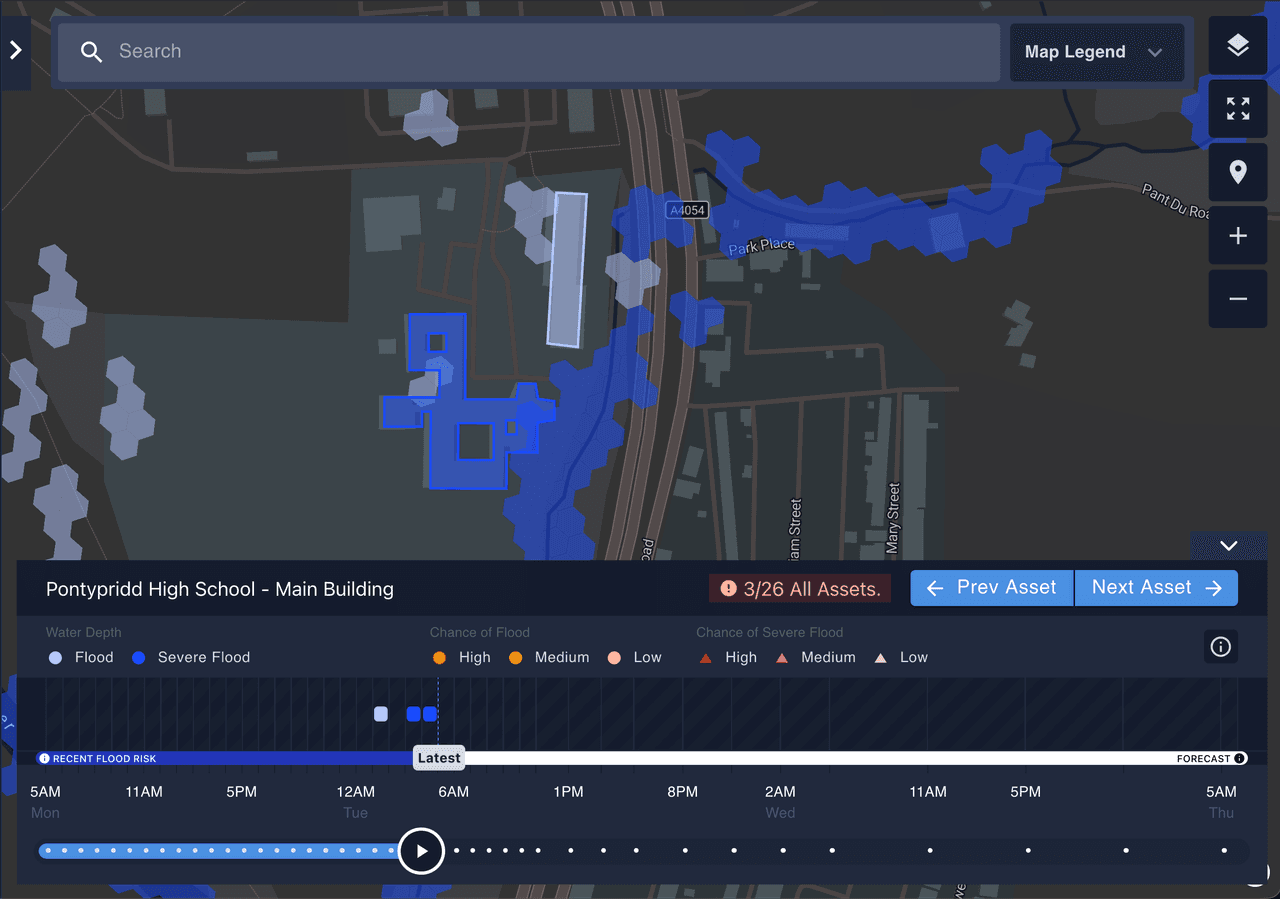
Map view, property level detail.
Visualise forecasted or observed flooding at any stage of a storm across the whole portfolio, at property level detail for every supported region. Outcome: see the extent, duration and shape of a storm before it arrives.
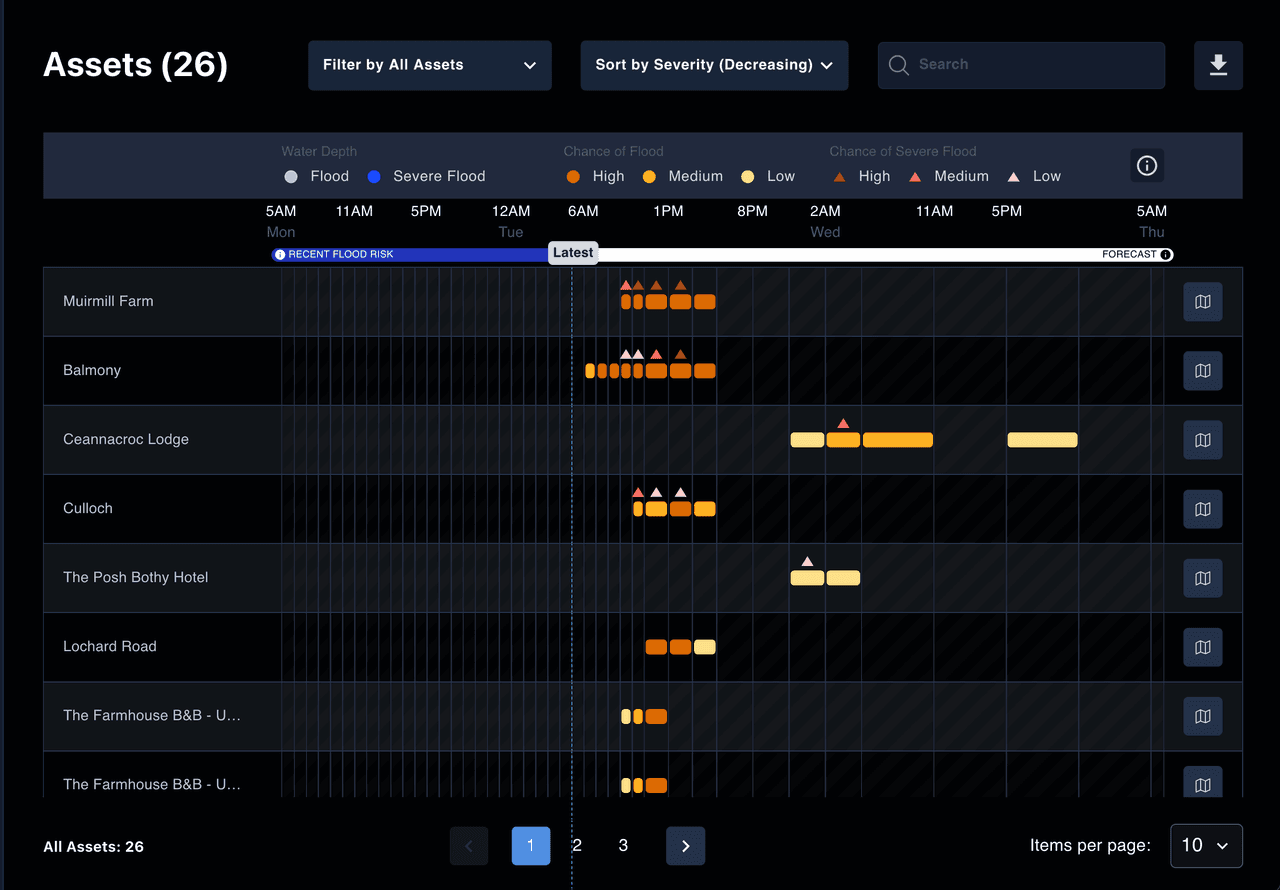
Asset view, ranked by risk.
Every asset with at least a low chance of flooding, triaged by time, duration, probability and severity, with the last 24 hours of lookback where available. Outcome: act on the sites that matter first.
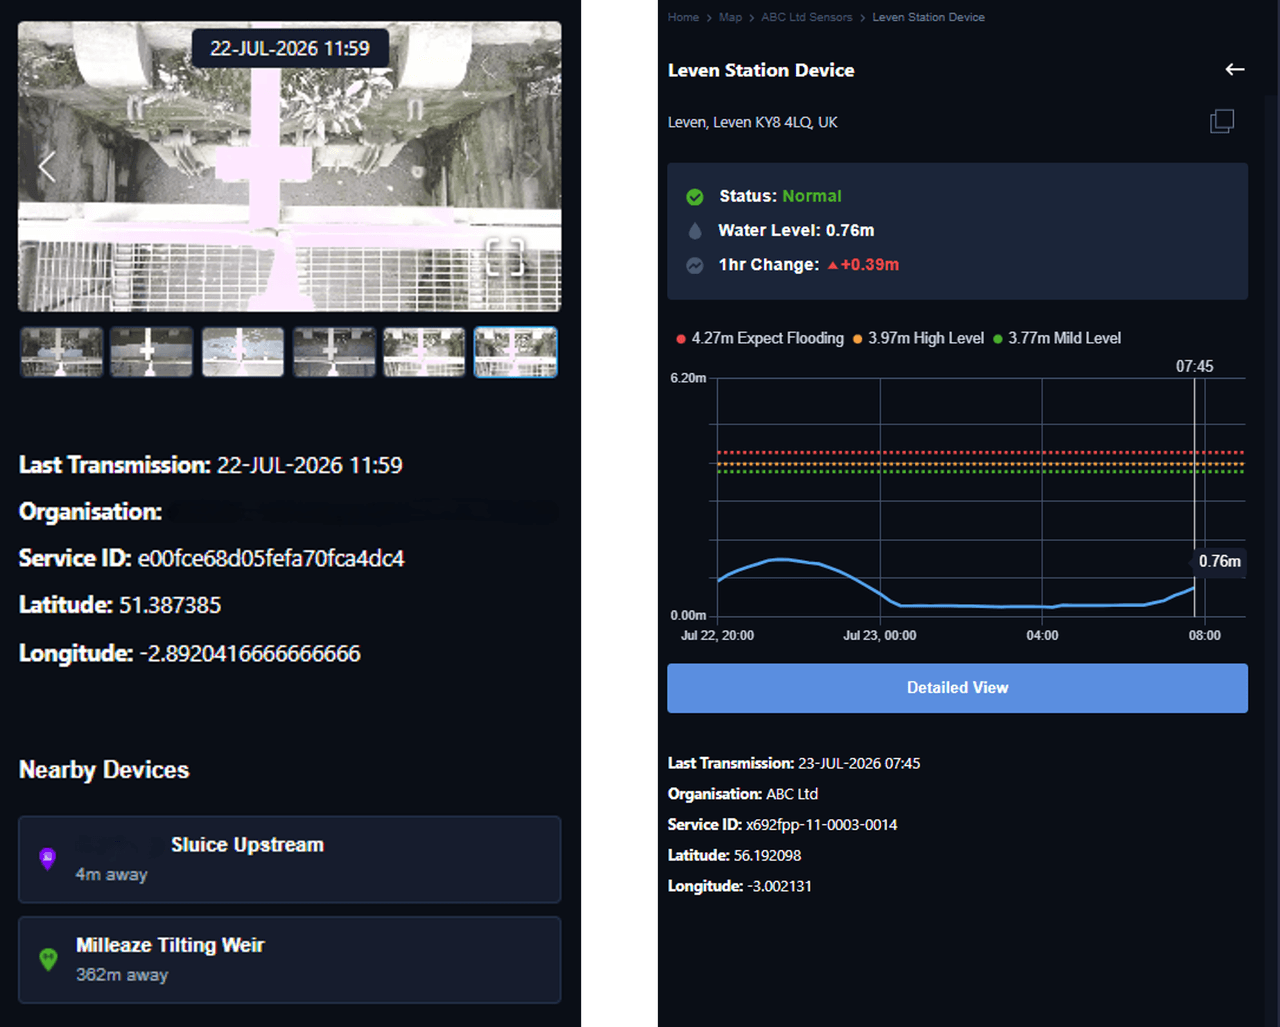
Sensors and cameras, in the same platform.
Radar level readings and camera imagery feed straight in alongside the forecast, with near-real-time alerts at set thresholds. Outcome: confirm the forecast against the ground before you commit resources.
Trusted by
Relied on by insurers, utilities and the organisations they protect.




Liberty Specialty Markets delivers the Previsico platform to its insureds through its Risk Reduce portal, integrated via our API.
Previsico's technology allows us to use data intelligently and integrate it seamlessly into our risk management portal for customers. This provides very real value to our insureds.”
Flood Intel Platform
Simulations behind every forecast.
Forecasts re-run in the run-up to a storm.
Every supported region.
Modelled from observed rainfall, adjustable to the window you need.
See the whole platform on your portfolio.
Talk to our team or explore how Previsico works for your sector.